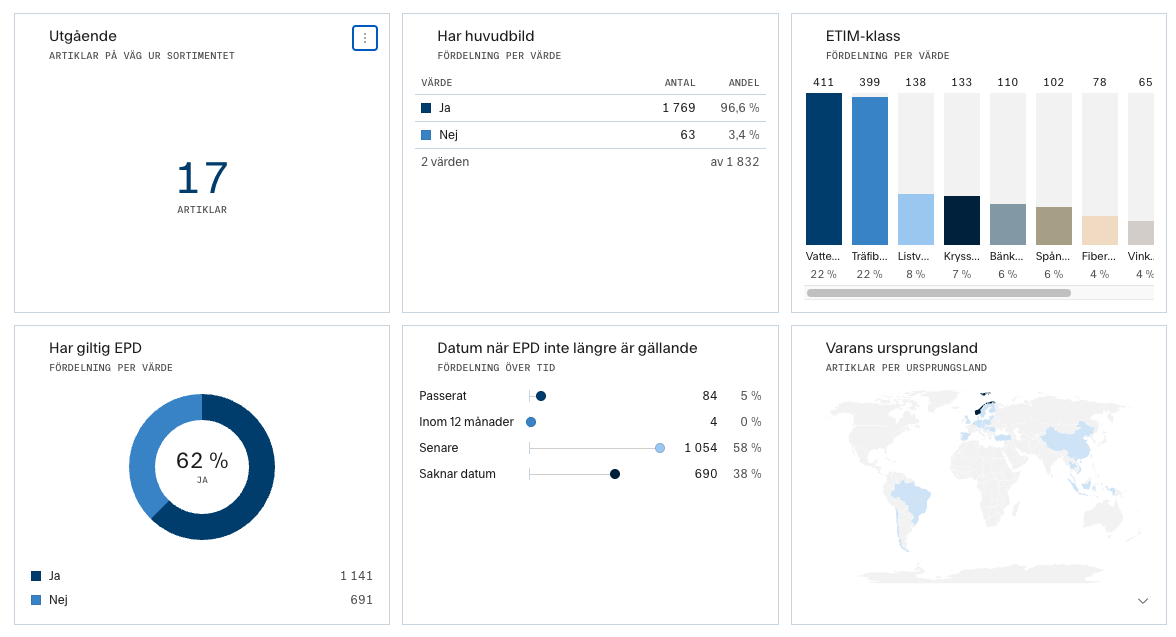
Under the Statistics heading, you get a quick overview of your item information in various graphs and charts. A number of standard charts are included from the start, but you can easily customise your statistics page to suit you and your information.
Add and customise
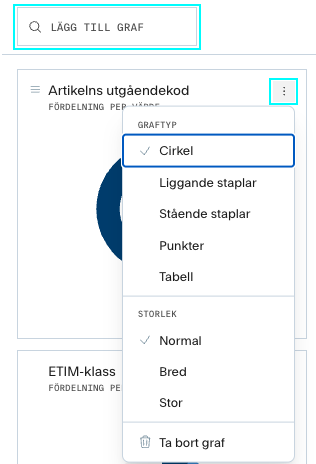
To add new charts, search for the information field you want in Add chart and click the field you want statistics for. Once you have created your chart, you can also choose its type and size by clicking in the top right corner.